**Guest post by tf
As of November 7th, Le Monde has changed its look. The new format makes greater use of color photos, eliminates the short resumés that used to precede articles, and provides a cleaner appearance in general. Readers in France have argued one way and the other about whether the paper is more ergonomic now or whether it has been dumbed down. Without having strong feelings on the larger question, there is one innovation that I particularly deplore: the new Le Monde has decided to introduce chartjunk to its repertoire.
Technorati Tags: chartjunk, Edward Tufte, Le Monde, tf
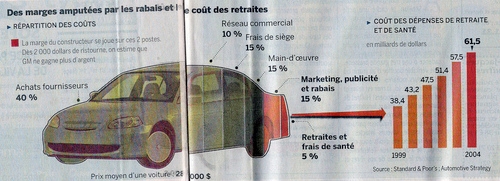
The graphic shown above is taken from an article about General Motors (GM) that appeared in the December 15th issue of Le Monde. It is a classic example of chartjunk, a term coined by Edward Tufte in The Visual Display of Quantitative Information (Graphics Press, 1983). In an information graphic, chartjunk is decoration that does not convey any data. This sort of chartjunk appeared in Le Monde 2, the newspaper’s glossy Sunday magazine, when the magazine was introduced some time back. Now it has found its way into the newspaper itself.
Here, we have a fairly detailed picture of an automobile that is used to convey only six values: the portion of the price of a car that goes to various categories of expense for GM. There are so many things wrong with this graphic, it is hard to know where to begin. Perhaps with the fact that the sizes of the colored areas have only the loosest of relationships with the values that they are meant to convey. Look, for instance, at the three colored areas that are each supposed to represent 15% of the total. The leftmost one is significantly wider than the other two. Given that it is also, on average, taller, it necessarily covers a bigger area on the page. Even if the reader is supposed to interpret values as corresponding to volumes in the three dimensional car, the leftmost 15% volume must necessarily be bigger than the other two, since the the car is of roughly uniform width from front to back.
I’ll leave it to readers of this blog to comment on the other problems with this graphic.
